The coordinate plane, also known as the Cartesian plane, is a two-dimensional plane formed by the intersection of two perpendicular number lines, typically referred to as the x-axis and y-axis.
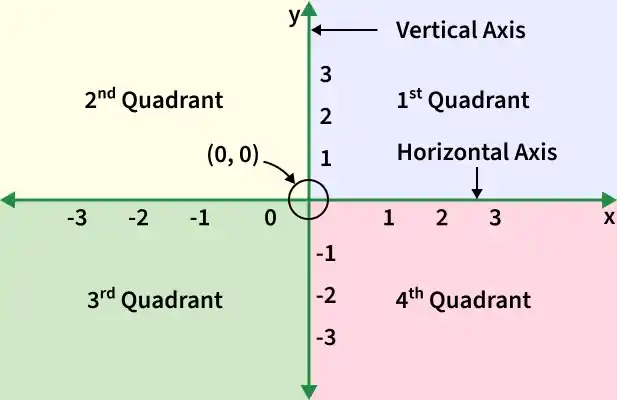
- The x-axis and y-axis meet at a point called the origin, written as (0, 0).
- Each point on the coordinate plane represents an ordered pair of real numbers called coordinates.
- The x-coordinate indicates how far to travel horizontally from the origin (right if positive and left if negative).
- The y-coordinate indicates how far to move vertically (up if positive, downward if negative).
Coordinate Plane Quadrants
Quadrants are the four regions of the coordinate plane created by the x-axis and y-axis. Each quadrant has different sign conventions and is represented by Roman numerals I, II, III, and IV.
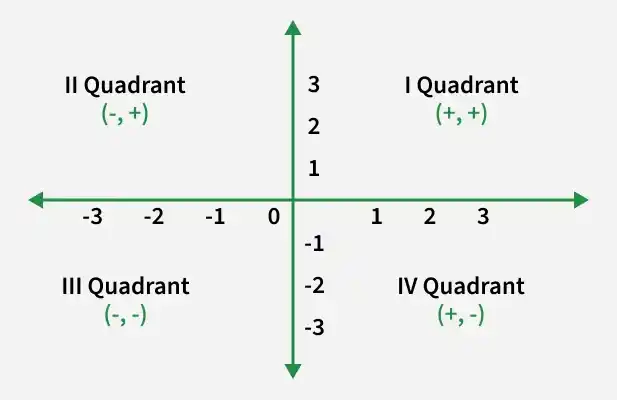
- Quadrant I: Quadrant I is located in the upper right. Quadrant I has positive values on both the x-axis and y-axis.
- Quadrant II: Quadrant II is located in the upper left, has negative numbers on the x-axis, and has positive numbers on the y-axis.
- Quadrant III: Quadrant III is located at the bottom left. Quadrant III has negative values on both the x-axis and y-axis.
- Quadrant IV: Quadrant IV is located in the bottom right corner. Quadrant IV has positive numbers on the x-axis and negative values on the y-axis.
Characteristics of a Coordinate Plane
There are various characteristics of the coordinate plane, such as:
- The coordinate plane is made up of two perpendicular axes, termed the coordinate axes, which intersect at a point known as the origin.
- A point's Cartesian coordinates may be calculated by measuring its distance from the origin along the x and y axes.
- The coordinate plane exhibits various types of symmetry, such as reflection symmetry across the x-axis, y-axis, or origin, depending on the nature of the geometric figure or function being analysed.
Graphing on a Coordinate Plane
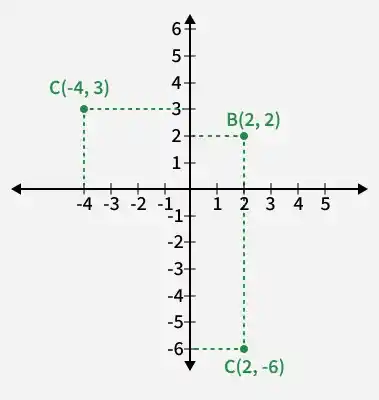
Let us learn how to build a graph step by step using the following points: (2, -6), (2, 2), and (-4, 3).
- Point (2, -6): Move 2 units to the right on the x-axis and 6 units down on the y-axis. This point lies in Quadrant IV.
- Point (2, 2): Move 2 units to the right on the x-axis and 2 units up on the y-axis. This point lies in Quadrant I.
- Point (-4, 3): Move 4 units to the left on the x-axis and 3 units up on the y-axis. This point lies in Quadrant II.
After plotting these points, join them with straight lines as shown in the graph.