

A scatter plot, also called a scatter graph, scattergram, scatter chart, or XY graph, uses dots to describe two different numeric variables. The position of each dot on the horizontal and vertical axes indicates values for an individual data point.
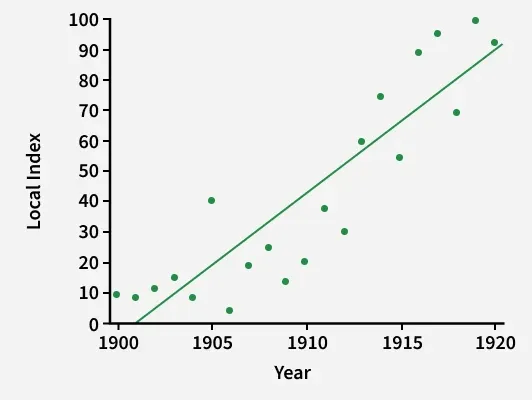
It is generally used to plot the relationship between one independent variable and one dependent variable, where an independent variable is plotted on the x-axis and a dependent variable is plotted on the y-axis so that you can visualize the effect of the independent variable on the dependent variable.
Applications
As already mentioned, a scatter plot is a very useful data visualization technique. A few applications of scatter plots are listed below.
- Correlation Analysis: A scatter plot is useful in the investigation of the correlation between two different variables. It can be used to find out whether two variables have a positive correlation, negative correlation, or no correlation.
- Outlier Detection: Outliers are data points that are different from the rest of the data set. A scatter plot is used to bring out these outliers on the surface.
- Cluster Identification: In some cases, scatter plots can help identify clusters or groups within the data.
Scatter Graph
A scatter plot is used to visualize a data pair, such that each element gets its axis; generally, the independent one gets the x-axis and the dependent one gets the y-axis.
This kind of distribution makes it easier to visualize the kind of relationship the plotted pair of data is holding. So a scatter plot is useful in situations when we have to find out the relationship between two sets of data or in cases when we suspect that there may be some relationship between two variables and this relationship may be the root cause of some problem.
Construction
To construct a scatter plot, we have to follow the given steps.
- Step 1: Identify the independent and dependent variables
- Step 2: Plot the independent variable on the x-axis.
- Step 3: Plot the dependent variable on the y-axis.
- Step 4: Extract the meaningful relationship between the given variables.
In the following table, a data set of two variables is given.
Matches Played | 2 | 5 | 7 | 1 | 12 | 15 | 18 |
|---|---|---|---|---|---|---|---|
Goals Scored | 1 | 4 | 5 | 2 | 7 | 12 | 11 |
Now in this data set there are two variables: First is the number of matches played by a certain player, and second is the number of goals scored by that player.
Suppose we aim to find out the relationship between the number of matches played by a certain player and the number of goals scored by him/her. For now, let us discard our obvious intuitive understanding that the number of goals scored is directly proportional to the number of matches played. For now, let us assume that we just have the given dataset and we have to extract the relationship between the given data pair.

As you can see in the given scatter plot, there is some kind of relationship between the number of matches played and the number of goals scored by a certain player.
Types of Scatter Graph
On the basis of the correlation of two variables, scatter plots can be classified into the following types.
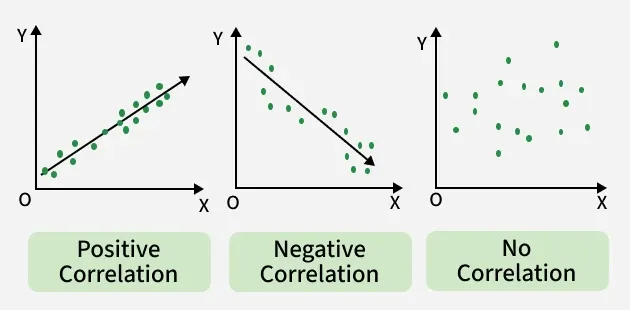
1. For Positive Correlation
In this type, the value on the y-axis increases on moving from left to right. In more technical terms, if one variable is directly proportional to another, then the scatter plot will show positive correlation. Positive correlation can be further classified into perfect positive, high positive, and low positive.
2. Negative Correlation
In this type the value on the y-axis decreases on moving from left to right. In other words, the value of one variable is decreasing with respect to the other. Positive correlation can be further classified into perfect negative, high negative, and low negative.
3. No Correlation
In this type, values are scattered all over the graph. Generally this kind of graph represents that there is no relationship between the two variables plotted on the scatter plot.
Scatter Plot Analysis
Scatter plot analysis involves examining the distribution of the points and interpreting the overall pattern to gain insights into the relationship between the variables. A scatter plot is used to visualize the relationship between two variables, but in real life, situations are not so ideal that we get only correlated variables. In real life there are situations when more than two variables are correlated with each other.
In such situations, we do use the scatter plot matrix. For n number of variables, the scatter plot matrix will have n rows and n columns, where the scatter plot of variables xi and xj will be located at the ith row and jth column.
