

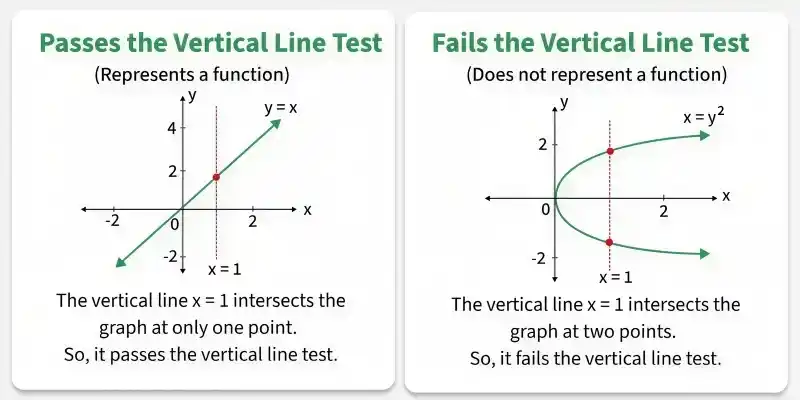
The vertical line test is used to determine whether the given equation is a function or not.
- It states that a graph represents a function if every vertical line intersects the graph only once.
- If even one vertical line intersects the graph at more than one point, the graph does not represent a function.
- The intersection of a vertical line and the curve represents the solution at that particular value of the input (x).
Applications
The applications of the vertical line test are as follows:
- Graphical Analysis: It helps in analyzing the behavior of different functions and their graphs.
- Curve Sketching: It helps determine whether a given curve sketch represents a function.
Working
The Vertical Line Test is used to determine whether a graph represents a function. A graph represents a function if every input value x has exactly one output value y.
To apply the Vertical Line Test, follow these steps:
- Look at the graph you want to test.
- Imagine drawing a vertical line from top to bottom at different values of x.
- Observe how many times the vertical line intersects the graph.
- If every vertical line intersects the graph at most once, the graph represents a function.
- If any vertical line intersects the graph more than once, the graph does not represent a function.
Solved Example
Example 1: Determine whether the graph of y = x2 passes the Vertical Line Test.
Solution:
The graph of y = x2 is shown below:

In this graph, a vertical line drawn for any value of x intersects the curve y=x2 at only one point. This confirms that y=x2 is a function, as it passes the Vertical Line Test.
Example 2: Determine whether the graph of x2+ y2 = 1 passes the Vertical Line Test.
Solution:
To determine if the curve x2+ y2 = 1 passes the Vertical Line Test, the graph is shown below:

In this graph, vertical lines intersect the curve at two points in many places, indicating that the graph does not represent a function. Therefore, the equation x2 + y2 = 1 fails the Vertical Line Test.
Although a vertical tangent line touches the circle at exactly one point, this does not make the circle a function. The Vertical Line Test must be satisfied for every vertical line, not just the tangent line.
Practice Problems
Problem 1: Examine the graph of the relation y = |x|. Does it pass the Vertical Line Test
Problem 2: Given the graph of a circle with the equation x2 + y2 = 25, determine if the graph represents a function using the Vertical Line Test.
Problem 3: Consider the graph of y = x3. Apply the Vertical Line Test to check if it is a function.
Problem 4: Look at the graph of the equation y=±√x. Does this relation pass the Vertical Line Test
Problem 5: For the graph of the equation y=1/x, test if it satisfies the Vertical Line Test.
Problem 6: Use the Vertical Line Test on the graph of y = sin(x). Does this graph represent a function
Problem 7: Evaluate the graph of x = y2 + 3 using the Vertical Line Test. Is this graph a function
Problem 8: Given a straight line graph of y = 3x + 2, determine if it passes the Vertical Line Test.
Problem 9: Look at the graph of the relation y = x2/4 + 2. Can it pass the Vertical Line Test
Problem 10: Examine the graph of a horizontal line y = 5. Does this line pass the Vertical Line Test
Answer Key
- The graph of y = ∣x∣ passes the Vertical Line Test. It is a function.
- The graph of the circle x2 + y2 = 25 fails the Vertical Line Test. It is not a function.
- The graph of y = x3 passes the Vertical Line Test. It is a function.
- The graph of y = ±√x fails the Vertical Line Test. It is not a function.
- The graph of y = 1/x passes the Vertical Line Test. It is a function.
- The graph of y = sin(x) passes the Vertical Line Test. It is a function.
- The graph of x = y2 + 3 fails the Vertical Line Test. It is not a function.
- The graph of y = 3x + 2 passes the Vertical Line Test. It is a function.
- The graph of y = x2/4+2 passes the Vertical Line Test. It is a function.
- The graph of the horizontal line y = 5 passes the Vertical Line Test. It is a function.
